📝 Summary
The User KPI Report is a powerful diagnostic tool that helps answer questions like:
-
“How many invoices has this user processed?”
-
“Which users have worked on this invoice?”
-
“Is one vendor being handled by multiple people?”
Use it to uncover workflow inefficiencies or simply monitor team activity.
📍 Accessing the User KPI Report
To access the report:
-
Hover over the Reports tab in the top navigation menu.
-
Click on User KPI Report.
Example:

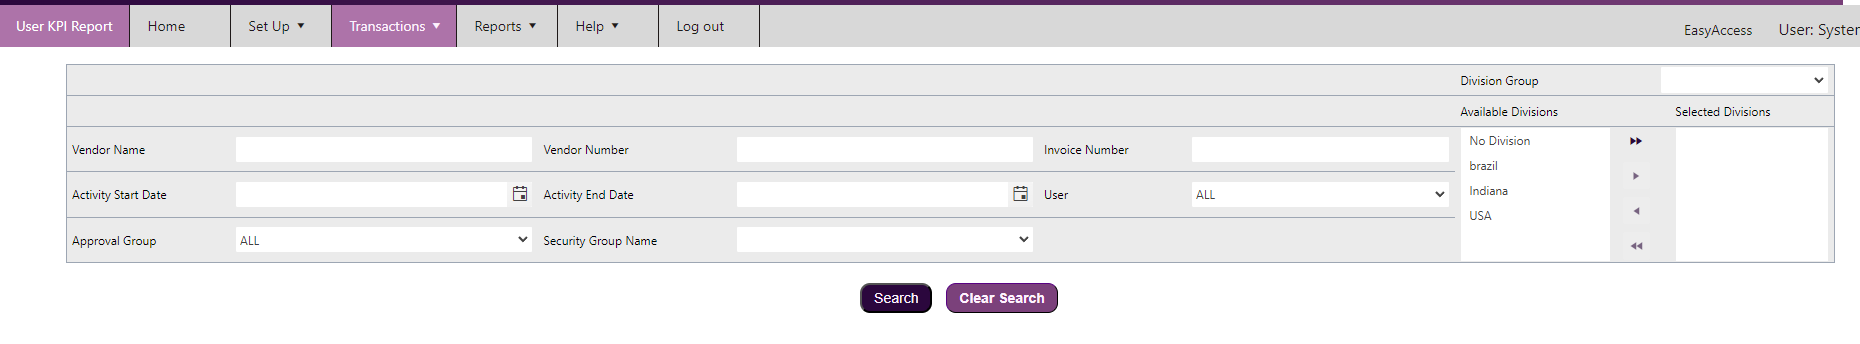
🔎 How the Report Works
Once you're on the User KPI Report screen, you’ll have several search filters available to tailor your results. You can filter by:
-
User
-
Vendor
-
Invoice Number
-
Activity Start Date
-
And more...
Example Filter Panel:
🧪 Examples of Common Use Cases
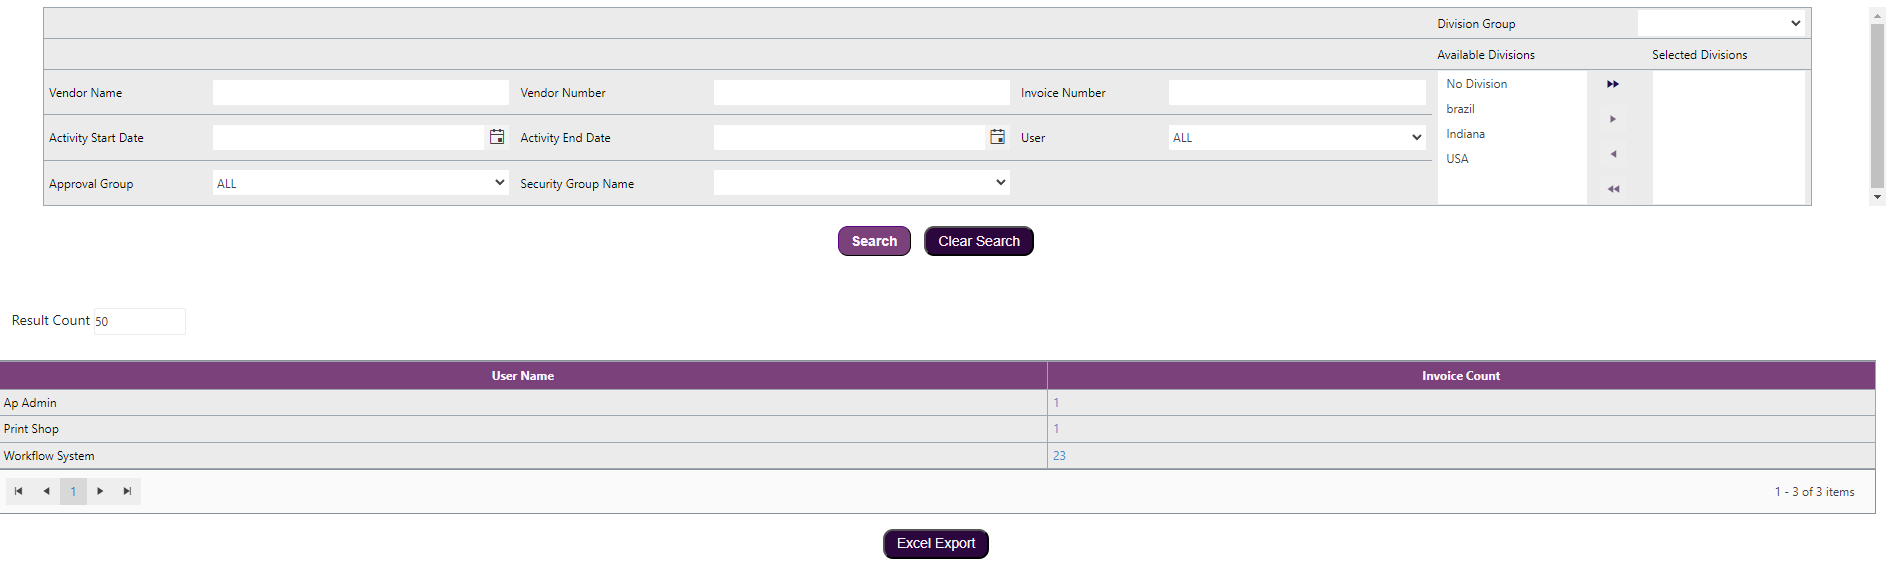
Example 1: See All User Activity
If you run the report without narrowing down by invoice or vendor, you’ll get a list of all users and how many invoices they’ve touched.
Example Output:
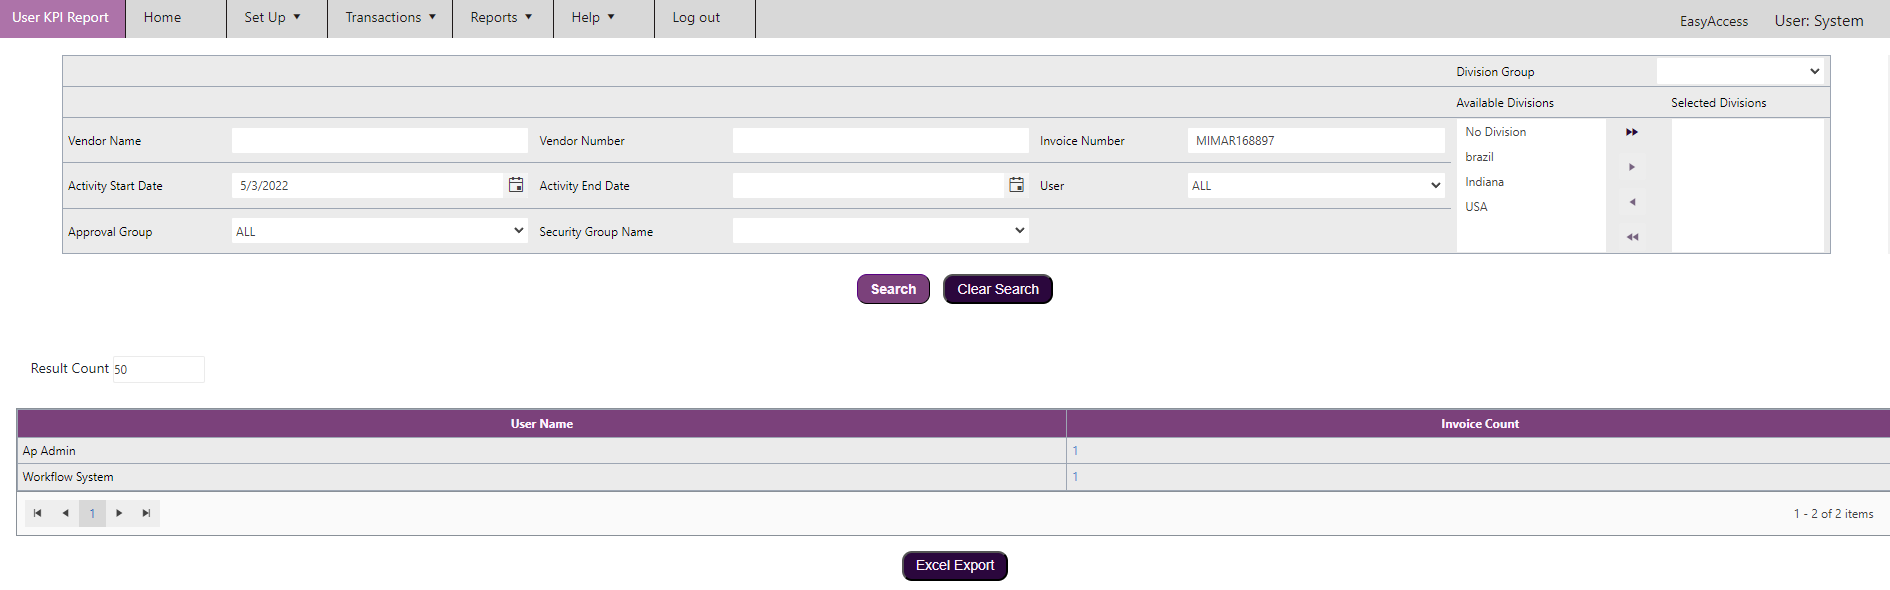
Example 2: Track Who Touched a Specific Invoice
By entering an Invoice Number and an Activity Start Date, you can see which users interacted with a specific invoice. This helps identify how invoices are being routed or reassigned.
Example Output:
💡 Pro Tips
-
Use this report during performance reviews to track invoice volumes by user.
-
Combine filters (e.g., by Vendor + Date Range) to isolate trends in vendor handling.
-
Helpful for identifying training gaps if invoices are repeatedly passed between users.
For help interpreting report results or tips on optimizing workflow efficiency, contact your support team or submit a Help Center ticket.